 Infographics are graphic visual representations of information, data or knowledge. These graphics present complex information quickly and clearly.
Modern practitioner Edward Tufte describes the process of incorporating many dimensions of information into a two-dimensional image as 'escaping flatland'.
Nigel Holmes calls them "explanation graphics" - dealing not only with the visual display of information but also of knowledge – how to do things.
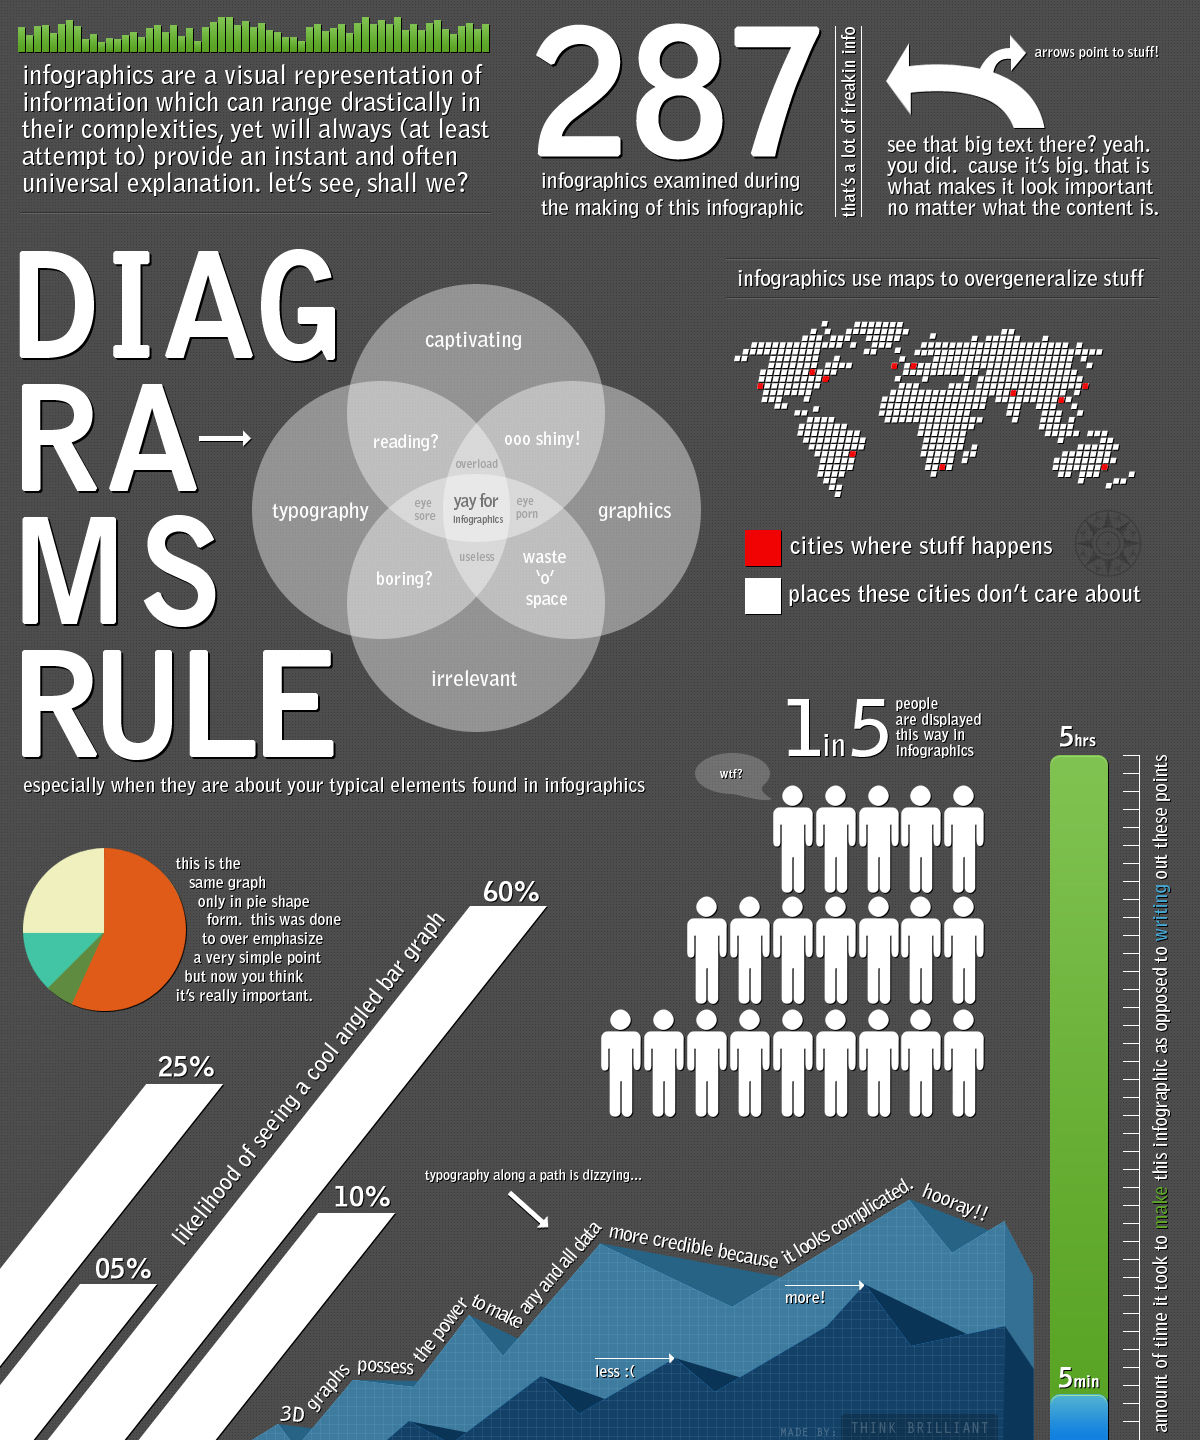
How are you using them? Or are you over them? Want to create one? Here's an infographic on making infographics - I think I hear the space-time continuum folding over on itself.

